NCAA Sponsorship
Intelligence Report
A record $1.2B in total college sponsorship revenue was generated across Power 4 and Group of 5 Conferences. Throughout the report, select the tabs to toggle between each conference tier's sponsorship insights.
Power 4 college sponsorship is now a billion-dollar market.
How Deal Size Shapes the Market
A small number of $1M+ deals account for a disproportionate share of total spend.
The middle market is the engine
The $50K–$250K tier is the real engine: 53% of deals driving $405.3M — 41% of all Power 4 spend. Meanwhile, just 1.5% of deals over $1M move $169.5M (17%).
Finance owns most $1M deals
Financial brands own the most, with 25 deals. Healthcare is second with 18 deals, then Insurance and Food & Bev Distribution tied at 7 each.
Total sponsorship revenue per conference and per-school average.
* Note: Pac-12 reflects 2025-26 members (Oregon State & Washington State).
The top 10 earners share a stage — but not a strategy.
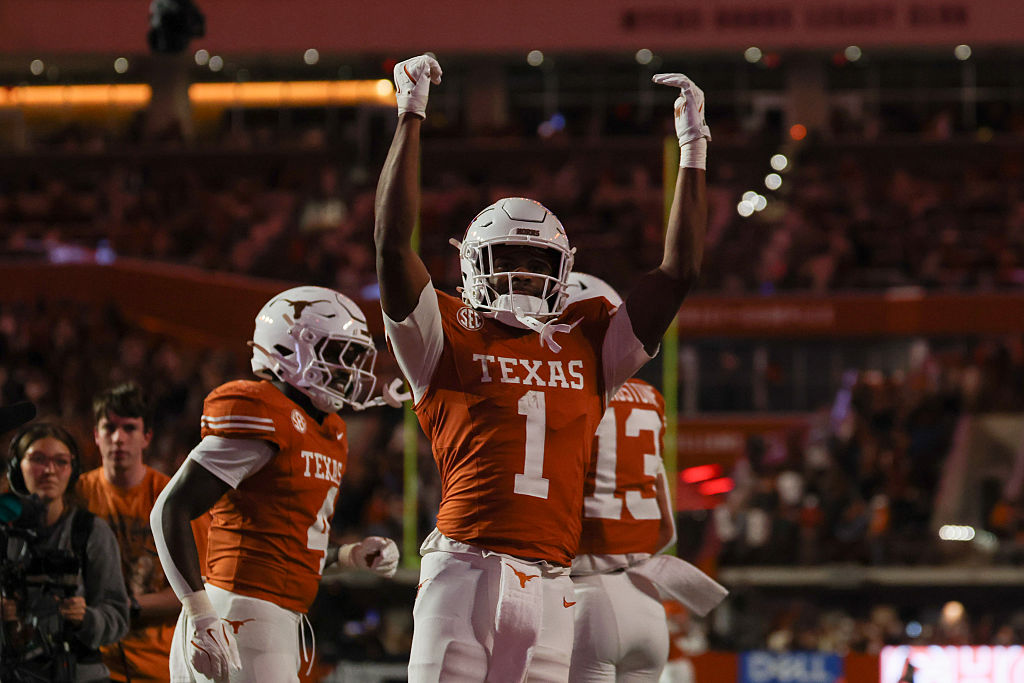
Texas Longhorns

Ohio State Buckeyes

LSU Tigers

Georgia Bulldogs

Tennessee Volunteers

Penn State Nittany Lions

Alabama Crimson Tide

USC Trojans

Nebraska Cornhuskers

Oklahoma Sooners

Three of the top 10 earners — Texas, Ohio State, and LSU — are already activating jersey-patch inventory before most P4 schools have even priced it. LSU landed the first P4 deal (Woodside Energy), Ohio State's Buckeye Sports Group is selling now, and Texas went live alongside >$10M in new spend.
USC and Oklahoma both crack the top 10 as realignment arrivals — USC riding Big Ten media reach, Oklahoma applying the SEC pricing premium. Combined with five incumbent SEC programs already on the list, the conference now holds half the leaderboard and the two newest entrants suggest the premium is real and immediate.
Alabama runs the most diversified book in P4 — no brand above 5% across 127 deals — while Penn State's top 5 brands hold 41% of its spend. Tennessee splits the difference with just two brands controlling 25%.
Who Owns the Power 4? The Brands Leading in Spend and Scale
Top 5 = 43.4% of P4 SPND
Finance leads with 464 deals and is the only category to exceed $100M in P4. Regional and national banks, credit unions, and investment platforms collectively make Financial the single most committed category in college sponsorship.
Top 5 categories account for 43.4% of P4 spend. Financial, Insurance, Auto, Healthcare, and Alcohol are the five pillars of P4 sponsorship.
(BRAND SPND HIDDEN)
Most brands buy one school. A handful build networks.
3,458 parent companies across Power 4
| SCHOOLS PER PARENT BRAND | # Brands | % Brands | SPND ($M) | % SPND |
|---|---|---|---|---|
| 1 school | 2,796 | 80.9% | $400.5M | 40% |
| 2–5 schools | 547 | 15.8% | $246.3M | 24.6% |
| 6–20 schools | 95 | 2.7% | $162.5M | 16.2% |
| 21–49 schools | 17 | 0.5% | $146.2M | 14.6% |
| 50+ schools | 3 | 0.1% | $44.8M | 4.5% |
College sponsorship is a renewal business — but brands must replace nine figures of churned revenue every cycle.
$176M in new spend replaced $153M in lost deals.
How college stacks up against pro leagues in deal volume and per-property spend.
Signage still anchors more than half of all sponsorship spend.
Signage dominates P4 revenue allocation at 54% ($542M) — more than all other categories combined. Physical in-venue presence remains the core activation vehicle; Digital Media and Social together account for just 4%.
The biggest openings are in concentrated categories — fewer brands, higher price points.
Concentrated
- Beverage-Non-Alc26 brands · $1.7M avg
- Insurance106 brands · $783K avg
- Telecom36 brands · $563K avg
- Consumer Electronics12 brands · $394K avg
- Gaming24 brands · $390K avg
Competitive
- Beverage-Alcohol109 brands · $596K avg
- Financial306 brands · $415K avg
- QSR135 brands · $378K avg
- Auto213 brands · $374K avg
- Healthcare254 brands · $313K avg
Emerging
- Consumer Services71 brands · $249K avg
- Technology69 brands · $166K avg
- Education18 brands · $116K avg
Fragmented
- Construction & Industrial368 brands · $162K avg
- Hotel/Rest/Leisure341 brands · $143K avg
- Business Services188 brands · $179K avg
How Categories Are Classified
Each sponsorship category is evaluated along two dimensions — brand density (the number of brands sponsoring per school) and deal value (the average spend per brand) — using Power 4 2025–26 data.
To create the quadrants, we calculate the median across all categories for each dimension. A category's position relative to those two medians determines its classification:
- Concentrated — Few brands, high spend. A small number of sponsors dominate with large deals.
- Competitive — Many brands, high spend. Crowded and expensive — the most actively contested categories.
- Emerging — Few brands, low spend. Early-stage or underexplored categories with room to grow.
- Fragmented — Many brands, low spend. Lots of sponsors, but deals tend to be smaller.
Financial, Auto, and Healthcare are the most Competitive categories — 3–5 brands per school with average deals above $300K.
Telecom is concentrated (36 brands, $563K avg) yet sits underpenetrated vs near-universal pro presence — an open lane for one differentiated player.
Where the dollars actually land — and why on-field logos are pulling away from every other asset.
Four physical asset categories absorb the majority of every sponsorship dollar.
Share of total sponsorship spend by asset type. Signage and TV-visible inventory dominate both tiers; venue naming over-indexes in Group of 5 where it carries more of the portfolio.
* Media assets (radio, broadcast, digital, etc.) are excluded.
Playing-surface logos are the one asset digital can't replicate — passive, persistent, broadcast-visible exposure that needs no opt-in. Brands are paying premiums to occupy them.
The deals setting the new ceiling.
Four partnerships that show what premium, broadcast-visible inventory now commands across the NCAA. (Spend hidden)
Largest single playing-surface deal in college sports.
Proof that national brands will write P4-sized checks in Group of 5 markets.
National brand anchoring the most-watched stadium in college football.
Regional anchor scaling with the program into Big Ten realignment.
Just over half of Power 4 schools have sold at least one naming deal — with room to grow.
* Some venue naming deals involve donor or university-funded contributions rather than pure brand sponsorship.
Where the naming dollars live.
- 1$2.52MArizona WildcatsCasino Del Sol
- 2$2.40MArizona State Sun DevilsMountain America CU
- 3$2.20MTennessee VolunteersFood City
- 4$2.20MTennessee VolunteersPilot Flying J
- 5$2.09MNebraska CornhuskersPinnacle Bank
- 6$1.97MUCLA BruinsWescom Financial
- 7$1.92MSyracuse OrangeJMA Wireless
- 8$1.87MOhio State BuckeyesValue City Furniture
- 9$1.77MLouisville CardinalsL&N FCU
- 10$1.43MIllinois Fighting IlliniState Farm
Stadium and arena naming still anchor the Power 4 naming market — but playing-surface, club, and entryway inventory now account for ~40% of naming spend, opening multiple entry points for brands that can't (or won't) chase the marquee venue name.
A brand-new asset class has opened — and the race has just begun.
The NCAA's January 2026 rule (effective August 1) allows up to two commercial logos on uniforms — the first time school-owned uniform inventory has been a saleable asset.
Projected Annual Jersey Patch Pricing Across Power 4 Tiers
Tap a tier to view schools. Ranges shown in USD (millions).
Early Movers
What to Know: The College Jersey Patch Market
The asset is proven at the pro level. Primary jersey patches generate $828M annually across six U.S. leagues (31% of major asset spend) — and the category is trending toward $1B+. College now has access to the same inventory.
College pricing needs its own framework. SponsorUnited has built a tiered model for Power 4 programs based on pro patch economics, market size, broadcast exposure, fan intensity, and program brand equity.
Early deals will set the ceiling. First-wave transactions (like LSU's landmark deal) anchor pricing expectations, renewal benchmarks, and long-term revenue trajectory. Programs that enter without data risk compressing their upside before the market matures.
Rights holders should treat this as flagship inventory. Jersey patches sit alongside naming rights and premium hospitality — not incremental add-ons. Scarcity and structured pricing guardrails protect long-term value.
Brands have a narrow early-mover window. First movers in NBA/MLS locked in top franchises before price inflation. College offers the same dynamic now — with added NIL integration, alumni affinity, and regional broadcast dominance.
The insights that matter most from this year's NCAA report.
College Sponsorship Hits a Record $1.2B — With Power 4 Crossing $1B for the First Time Power 4 schools generated over $1B in sponsorship revenue across 70 programs, while Group of 5 earned $195M — bringing the combined NCAA total to a record $1.2B. The top programs now exceed $30M individually, rivaling mid-tier professional franchises.
Brands Spend a Median of $146K, but a Handful of Mega-Deals Drive the Market The median spend per brand in Power 4 was $146K, while the median individual deal sat at $90K — a gap that reflects heavy concentration at the top. A small number of anchor partnerships are pulling the average significantly higher, meaning most brands are still entering at accessible price points.
Playing Surfaces and Naming Rights Are the Highest-Value Real Estate in College Sports Nearly $25.3M — or ~2.5% of all Power 4 sponsorship revenue — came from deals that put a brand name or logo on the playing surface. Full venue naming rights deals averaged $1.7M annually, with FedEx's commitment to Memphis proving that national brands will write Power 4-sized checks into Group of 5 markets when the asset is right.
Jersey Patches Are the Next Frontier — and ~95% of Inventory Is Still Unsold Early deals — led by LSU's landmark agreement — already demonstrate seven-figure ceiling potential, following the NBA and NHL playbook. With the vast majority of schools yet to sell this asset, jersey patches represent the single largest untapped revenue opportunity in college sponsorship over the next 2–3 cycles.
Texas Leads All Schools, and Conference Parity Is Tightening Texas topped all programs in total sponsorship revenue, anchoring a broader trend of growth across the Power 4. The Big 12 now sits within striking distance of the Big Ten, and no conference outside the SEC is out of reach — signaling that sponsorship dollars are following media exposure and market size, not just on-field performance.
Group of 5 Conferences Are Top-Heavy — and Realignment Is About to Reshape It Group of 5's $195M in sponsorship revenue is disproportionately concentrated in a small number of marquee deals — in some cases, a single partnership accounts for over half a program's total spend. Look past those and the brand leaderboard collapses into a handful of national names — led by beverage, apparel, and auto — buying local reach, not national exposure. Meanwhile, four of the top 10 Group of 5 schools by spend depart for the Pac-12 in July 2026, taking significant revenue with them and redrawing the Group of 5 power map in real time.
Want to learn more?
Request a walkthrough of the SponsorUnited platform and see how SPND can power your sponsorship strategy.